
Quantification
of Gene Expression
Encyclopedia
of DNA Element - Gene Expression Atlas - Brain Atlas - Human Proteome
Maps ... and more ...
mRNA
Transcript
Analysis
The
inclusion of transcriptome anaylsis dataset to the Human Protein Atlas
database makes it even more comprehensive
Posted by RNA-Seq Blog -- from Health Canal
The Human Protein
Atlas was launched in April 2016. The new version includes data from
different sources, which makes comparisons between tissue profiles on
both the RNA and protein level possible. => Visit your
favorite gene to browse our new layout on the Tissue Atlas!
Looking closely at healthy and sick conditions in
the human tissues or cells makes it possible to learn more and thereby
improve healthcare. To do this comparisons the researchers first need
to know how the human body is built. One way is to analyze the
transcriptome. This means looking into which genes are activated to
create a protein in the tissue or cell sample.
The human biology is constructed in three steps;
from DNA to RNA and then to protein. The DNA code needs to be copied to
the RNA, and then read to make a protein. To detect and count protein
molecules is very complicated and the scientists need different methods
to make sure the data is valid. One way is to analyze the transcriptome
to count the amount of RNA molecules being copied from the DNA of a
certain gene, creating a picture of what proteins to expect from the
sample. Counting RNA molecules is easier than counting protein
molecules.
The Human Protein Atlas includes proteome analysis
based on more than 25 000 antibodies targeting more than 17 000 unique
proteins, combined with transcriptome analysis covering all 20 000
human protein coding genes. The new atlas launched on April 11 also
includes primary data from several sources, which allows for
comparisons.
The new version of the Human Protein Atlas is
significantly advancing in terms of mapping the transcriptome in
different human tissues. These data have been the basis for much of the
metabolic modelling we are doing here at Chalmers. I am therefore very
excited about the progress, and the Human Protein Atlas will certainly
be an important resources in our aims to advance towards better
diagnostics and precision medicine, says Professor Jens Nielsen at the
Department of Biology and Biological Engineering.
Global transcriptomics analysis of human
tissues and organs
Overview of the tissues and organs
analyzed using RNA-seq by the Human Protein Atlas consortium (HPA,
green), tissues studied with cap analysis gene expression (CAGE) within
the FANTOM consortium (purple), and tissues analyzed using RNA-seq by
the genome-based tissue expression consortium (GTEx, orange).
Altogether, 22 tissues and organs were studied with both the HPA and
FANTOM datasets, while 21 tissues overlapped between the HPA and GTEx
datasets.
The launch is accompanied by an article in Molecular
Systems Biology describing transcriptome resources with a focus on
the comparison between the datasets generated from the Broad Institute,
Boston, US (GTEx) and the Human Protein Atlas. The GTEx dataset
includes more than 1600 samples from mostly overlapping, but in some
cases unique, tissues compared to the Human Protein Atlas. RNA-seq data
from 28 of the GTEx tissues with a corresponding tissue in Human
Protein Atlas have been included to allow for direct comparisons
between the Human Protein Atlas and GTEx data sets.
The inclusion of the GTEx dataset to the Human
Protein Atlas database makes it even more comprehensive and it is
reassuring that there is a significant overlap in the tissue
classification of the genes based on the two independent datasets, says
Professor
Mathias Uhlén, program director for the Human Protein Atlas
project.
The article published in Molecular Systems Biology
discusses publicly available human transcriptome resources and the
possible use of these databases for various applications, such as
building genome-scale metabolic models used for analyzing cell and
tissue functions both in health an disease contexts.
=> Visit your
favorite gene to browse our new layout on the Tissue Atlas!
Transcriptomics
resources of human tissues and organs
Mathias Uhlén, Björn M Hallström, Cecilia Lindskog,
Adil Mardinoglu, Fredrik Pontén, Jens Nielsen
Molecular Systems Biology 12: 862 | 2016
Quantifying the
differential expression of genes in various human organs, tissues, and
cell types is vital to understand human physiology and disease.
Recently, several large-scale transcriptomics studies have analyzed the
expression of protein-coding genes across tissues. These datasets
provide a framework for defining the molecular constituents of the
human body as well as for generating comprehensive lists of proteins
expressed across tissues or in a tissue-restricted manner. Here, we
review publicly available human transcriptome resources and discuss
body-wide data from independent genome-wide transcriptome analyses of
different tissues. Gene expression measurements from these independent
datasets, generated using samples from fresh frozen surgical specimens
and postmortem tissues, are consistent. Overall, the different
genome-wide analyses support a distribution in which many proteins are
found in all tissues and relatively few in a tissuerestricted manner.
Moreover, we discuss the applications of publicly available omics data
for building genome-scale metabolic models, used for analyzing cell and
tissue functions both in physiological and in disease contexts.
|
|
Welcome to MTD database
MTD -- A mammalian transcriptomic database
to explore gene expression and regulation.
Sheng X, Wu J, Sun Q, Li X, Xian F, Sun M, Fang W, Chen M, Yu J, Xiao J
Brief Bioinform. 2016 Jan 27. pii: bbv117
A systematic transcriptome survey is essential for the characterization
and comprehension of the molecular basis underlying phenotypic
variations. Recently developed RNA-seq methodology has facilitated
efficient data acquisition and information mining of transcriptomes in
multiple tissues. Current mammalian transcriptomic databases are either
tissue specific or species specific, and they lack in-depth comparative
features across tissues and species. Here, we present a MTD that is
focused on mammalian transcriptomes with a current version that
contains data from humans, mice, rats and pigs. Regarding the core
features, the MTD browses genes based on their neighboring genomic
coordinates or joint KEGG pathway and provides expression information
on exons, transcripts, and genes by integrating them into a genome
browser. We developed a novel nomenclature for each transcript that
considers its genomic position and transcriptional features. The MTD
allows a flexible search of genes or isoforms with user-defined
transcriptional characteristics and provides both table-based
descriptions and associated visualizations. To elucidate the dynamics
of gene expression regulation, the MTD also enables comparative
transcriptomic analysis in both intraspecies and interspecies manner.
The MTD thus constitutes a valuable resource for transcriptomic and
evolutionary studies. The MTD is freely accessible at http://mtd.cbi.ac.cn/
Further connected papers => http://bigd.big.ac.cn/publications
|
 |
|
 |
|
Nature Editor's
summary
More than a decade
after publication of the draft human genome sequence, there is no
direct equivalent for the human proteome. But in this issue of Nature
two groups present mass spectrometry-based analysis of human tissues,
body fluids and cells mapping the large majority of the human proteome.
- Akhilesh Pandey and
colleagues
identified 17,294 protein-coding genes and provide evidence of tissue-
and cell-restricted proteins through expression profiling. They
highlight the importance of proteogenomic analysis by identifying
translated proteins from annotated pseudogenes, non-coding RNAs and
untranslated regions. The data set is available on http://www.humanproteomemap.org
- Bernhard Kuster and
colleagues have assembled protein evidence for 18,097 genes in
ProteomicsDB (available on https://www.proteomicsdb.org)
and highlight the utility of the data, for example the identification
of hundreds of translated lincRNAs, drug-sensitivity markers and discovering the
quantitative relationship between mRNA and protein levels in tissues. Elsewhere
in this issue, Vivien Marx reports on a third major proteomics project,
the antibody-based Human Protein Atlas programme http://www.proteinatlas.org
|
Mass-spectrometry-based draft of the human
proteome
Wilhelm M, Schlegl J, Hahne H, Moghaddas Gholami A, Lieberenz M,
Savitski MM, Ziegler E, Butzmann L, Gessulat S, Marx H, Mathieson T,
Lemeer S, Schnatbaum K, Reimer U, Wenschuh H, Mollenhauer M,
Slotta-Huspenina J, Boese JH, Bantscheff M, Gerstmair A, Faerber F, and
Kuster B.
Nature. 2014 509(7502): 582-487
Proteomes are
characterized by
large protein-abundance differences, cell-type- and time-dependent
expression patterns and post-translational modifications, all of which
carry biological information that is not accessible by genomics or
transcriptomics. Here we present a mass-spectrometry-based draft of the
human proteome and a public, high-performance, in-memory database for
real-time analysis of terabytes of big data, called ProteomicsDB. The
information assembled from human tissues, cell lines and body fluids
enabled estimation of the size of the protein-coding genome, and
identified organ-specific proteins and a large number of translated
lincRNAs (long intergenic non-coding RNAs). Analysis of messenger RNA
and protein-expression profiles of human tissues revealed conserved
control of protein abundance, and integration of drug-sensitivity data
enabled the identification of proteins predicting resistance or
sensitivity. The proteome profiles also hold considerable promise for
analysing the composition and stoichiometry of protein complexes.
ProteomicsDB thus enables navigation of proteomes, provides biological
insight and fosters the development of proteomic technology.
http://www.nature.com/nature/journal/v509/n7502/full/nature13319.html
|
|
 |
Extended
Data Figure 7: Protein- versus mRNA-expression analysis
a,
Comparison of mRNA and protein expression of 12 human tissues showing
the general rather poor correlation of protein and mRNA levels,
implying the widespread application of transcriptional, translational
and post-translational control mechanisms of protein-abundance
regulation. Spearman correlation coefficients vary from 0.41 (thyroid
gland) to 0.55 (kidney). ‘Corner proteins’ (0.5 logs to either side of
zero) are marked in colours.
b, Clustering of
mRNA expression (left triangle) and protein expression (right triangle)
across the 12 tissues does not reveal tissues with common profiles
suggesting that the transcriptomes and proteomes of human tissues are
quite different from each other.
c, The ratio of
protein and mRNA level for a protein is approximately constant across
many tissues. The heat map shows proteins and tissues clustered
according to their protein/mRNA ratio.
d, Protein
abundance can be predicted from mRNA levels. Using the median ratio of
protein/mRNA across 12 tissues, it is possible to predict protein
levels from mRNA levels for every tissue with a good correlation
coefficient, underscoring the importance of the translation rate (and
mRNA levels) on protein expression.

|
|
A draft map of the
human proteome
Kim MS, Pinto SM, Getnet D, Nirujogi RS, Manda SS,
Chaerkady R, Madugundu AK, Kelkar DS, Isserlin R, Jain S, Thomas JK,
Muthusamy B, Leal-Rojas P, Kumar P Sahasrabuddhe NA, Balakrishnan B,
Advani J, George B, Renuse S, Selvan LD, Patil AH, Nanjappa V,
Radhakrishnan A, Prasad S, Subbannayya T, Raju R, Kumar M,
Sreenivasamurthy SK, Marimuthu A, Sathe GJ, Chavan S, Datta KK,
Subbannayya Y, Sahu A Yelamanchi SD, Jayaram S, Rajagopalan P, Sharma
J, Murthy KR, Syed N, Goel R, Khan AA, Ahmad S, Dey G, Mudgal K,
Chatterjee A, Huang TC, Zhong J, Wu X, Shaw PG, Freed D, Zahari MS,
Mukherjee KK, Shankar S, Mahadevan A Lam H, Mitchell CJ, Shankar SK,
Satishchandra P, Schroeder JT, Sirdeshmukh R, Maitra A, Leach SD, Drake
CG, Halushka MK, Prasad TS, Hruban RH, Kerr CL, Bader GD,
Iacobuzio-Donahue CA, Gowda H, Pandey A.
Nature. 2014 509(7502): 575-581
The availability of human genome sequence has transformed biomedical
research over the past decade. However, an equivalent map for the human
proteome with direct measurements of proteins and peptides does not
exist yet. Here we present a draft map of the human proteome using
high-resolution Fourier-transform mass spectrometry. In-depth proteomic
profiling of 30 histologically normal human samples, including 17 adult
tissues, 7 fetal tissues and 6 purified primary haematopoietic cells,
resulted in identification of proteins encoded by 17,294 genes
accounting for approximately 84% of the total annotated protein-coding
genes in humans. A unique and comprehensive strategy for proteogenomic
analysis enabled us to discover a number of novel protein-coding
regions, which includes translated pseudogenes, non-coding RNAs and
upstream open reading frames. This large human proteome catalogue
(available as an interactive web-based resource at
http://www.humanproteomemap.org) will complement available human genome
and transcriptome data to accelerate biomedical research in health and
disease.
|
|
Tissue-based map of the human proteome
Mathias Uhlén, Linn Fagerberg, Björn M.
Hallström, Cecilia Lindskog, Per Oksvold, Adil Mardinoglu,
Åsa Sivertsson, Caroline Kampf, Evelina Sjöstedt Anna
Asplund, IngMarie Olsson, Karolina Edlund6 Emma Lundberg, Sanjay
Navani, Cristina Al-Khalili Szigyarto, Jacob Odeberg, Dijana
Djureinovic, Jenny Ottosson Takanen, Sophia Hober, Tove Alm, Per-Henrik
Edqvist, Holger Berling, Hanna Tegel, Jan Mulder, Johan Rockberg, Peter
Nilsson, Jochen M. Schwenk, Marica Hamsten, Kalle von Feilitzen,
Mattias Forsberg, Lukas Persson, Fredric Johansson, Martin Zwahlen,
Gunnar von Heijne, Jens Nielsen, Fredrik Pontén
Science 23 January 2015, Vol. 347 no. 6220
INTRODUCTION:
Resolving the molecular details of proteome variation in the different
tissues and organs of the human body would greatly increase our
knowledge of human biology and disease. Here, we present a map of the
human tissue proteome based on quantitative transcriptomics on a tissue
and organ level combined with protein profiling using microarray-based
immunohistochemistry to achieve spatial localization of proteins down
to the single-cell level. We provide a global analysis of the secreted
and membrane proteins, as well as an analysis of the expression
profiles for all proteins targeted by pharmaceutical drugs and proteins
implicated in cancer.
RATIONALE: We have
used an integrative omics approach to study the spatial human proteome.
Samples representing all major tissues and organs (n = 44) in the human
body have been analyzed based on 24,028 antibodies corresponding to
16,975 protein-encoding genes, complemented with RNA-sequencing data
for 32 of the tissues. The antibodies have been used to produce more
than 13 million tissue-based immunohistochemistry images, each
annotated by pathologists for all sampled tissues. To facilitate
integration with other biological resources, all data are available for
download and cross-referencing.
RESULTS: We report
a genome-wide analysis of the tissue specificity of RNA and protein
expression covering more than 90% of the putative protein-coding genes,
complemented with analyses of various subproteomes, such as predicted
secreted proteins (n = 3171) and membrane-bound proteins (n = 5570).
The analysis shows that almost half of the genes are expressed in all
analyzed tissues, which suggests that the gene products are needed in
all cells to maintain “housekeeping” functions such as cell growth,
energy generation, and basic metabolism. Furthermore, there is
enrichment in metabolism among these genes, as 60% of all metabolic
enzymes are expressed in all analyzed tissues. The largest number of
tissue-enriched genes is found in the testis, followed by the brain and
the liver. Analysis of the 618 proteins targeted by clinically approved
drugs unexpectedly showed that 30% are expressed in all analyzed
tissues. An analysis of metabolic activity based on genome-scale
metabolic models (GEMS) revealed liver as the most metabolically active
tissue, followed by adipose tissue and skeletal muscle.
CONCLUSIONS: A
freely available interactive resource is presented as part of the Human
Protein Atlas portal (www.proteinatlas.org), offering the possibility
to explore the tissue-elevated proteomes in tissues and organs and to
analyze tissue profiles for specific protein classes. Comprehensive
lists of proteins expressed at elevated levels in the different tissues
have been compiled to provide a spatial context with localization of
the proteins in the subcompartments of each tissue and organ down to
the single-cell level.
|

|
click
to enlarge
|
|
|
The Expression Atlas
provides information on gene expression patterns under different
biological conditions. Gene expression data is re-analysed in-house to
detect genes showing interesting baseline and differential expression
patterns.
The
Gene Expression Atlas (ArrayExpress Atlas) is a semantically enriched
database of meta-analysis based summary statistics which serves queries
for condition specific gene expression patterns (e.g. genes
over-expressed in a particular tissue or disease state) as well as
broader exploratory searches for biologically interesting
genes/samples. It is based on a subset of the ArrayExpress data.
Gene
Expression Atlas goals:
- Provision
of a statistically robust framework for integration of gene expression
experiment results across different platforms at a meta-analytical
level
- A simple interface for identifying strong
differential expression candidate genes in conditions of interest
- Integration of ontologies for high quality
annotation of gene and sample attributes
- Construction
of new gene expression summarized views, with a view to analysis of
putative signalling pathway targets, discovery of correlated gene
expression patterns and the identification of condition/tissue-specific
patterns of gene expression.
|
|
|
About the Expression
Atlas
The Expression Atlas provides information on gene expression patterns
under different biological conditions such as a gene knock out, a plant
treated with a compound, or in a particular organism part or cell. It
includes both microarray and RNA-seq data. The data is re-analysed
in-house to detect interesting expression patterns under the conditions
of the original experiment. There are two components to the Expression
Atlas, the Baseline Atlas and the Differential Atlas:
Baseline
Atlas - The Baseline Atlas displays information about which
gene products are present (and at what abundance) in "normal"
conditions (e.g. tissue, cell type). It aims to answer questions such
as:
- which genes are specifically expressed in
kidney?
- what is the expression pattern for gene SAA4
in normal tissues?
This component of the Expression Atlas consists of
highly-curated and quality-checked RNA-seq experiments from
ArrayExpress. It has data for several mammalian species as well as
opossum and rice. New experiments are added as they become available.
See the Baseline Atlas help page for information about how to search
and interpret the results in the Baseline Atlas.
Differential
Atlas - The Differential Atlas allows users to identify genes
that are up- or down-regulated in a wide variety of different
experimental conditions such as yeast mutants, cadmium treated plants,
cystic fibrosis or the effect on gene expression of mind-body practice.
Both microarray and RNA-seq experiments are included in the
Differential Atlas. Experiments are selected from ArrayExpress and
groups of samples are manually identified for comparison e.g. those
with wild type genotype compared to those with a gene knock out. Each
comparison is called a contrast. Each experiment is processed through
our in-house differential expression statistical analysis pipeline to
identify genes with a high probability of differential expression.
The Differential Atlas help page has more information about how to
search and interpret the results in the Differential Atlas.
Searches
enhanced by ontology-based query expansion
The Expression Atlas interface allows searches by gene, splice variant
and protein attribute. Individual genes or gene sets can be searched
for. Both the Baseline and Differential Atlas are queried by default.
Sample attributes and experimental conditions can also be searched for.
Experimental conditions e.g. cerebellum or breast carcinoma, are mapped
to ontology terms from the Experimental Factor Ontology (EFO). Mappings
are made either manually by curators or automatically using
EBI-developed software called Zooma. The ontology mappings allow for
ontology-driven query expansion e.g. searching for 'cancer' will return
matches to the keyword and also results for different types of cancer
such as 'breast carcinoma' and 'acute myeloid leukemia'.
References
|
|
ENCODE Overview
The National Human
Genome Research Institute (NHGRI) launched a public research consortium
named ENCODE, the Encyclopedia Of DNA Elements,
in September 2003, to carry out a project to identify all functional
elements in the human genome sequence. The project started with two
components - a pilot phase and a technology development phase.
The pilot phase tested and compared existing methods
to rigorously analyze a defined portion of the human genome sequence (See: ENCODE Pilot Project). The
conclusions
from this pilot project were published in June 2007 in Nature (download
PDF) and Genome Research [genome.org].
The findings highlighted the success of the project to identify and
characterize functional elements in the human genome. The technology
development phase also has been a success with the promotion of several
new technologies to generate high throughput data on functional
elements.
With the success of the initial phases of the ENCODE
Project, NHGRI funded new awards in September 2007 to scale the ENCODE
Project to a production phase on the entire genome along with
additional pilot-scale studies. Like the pilot project, the ENCODE
production effort is organized as an open consortium and includes
investigators with diverse backgrounds and expertise in the production
and analysis of data (See: ENCODE Participants and
Projects). This production phase also includes a Data
Coordination Center [genome.ucsc.edu] to track, store and display
ENCODE data along with a Data Analysis Center to assist in integrated
analyses of the data. All data generated by ENCODE participants will be
rapidly released into public databases (See: Accessing ENCODE
Data) and available through the project's Data Coordination
Center.
|
|
|
|
About ENCODE data
The Encyclopedia of DNA Elements (ENCODE)
Consortium is an international collaboration of research
groups funded by the National Human Genome
Research Institute (NHGRI).
The
goal of ENCODE is to build a comprehensive parts list of functional
elements in the human genome, including elements that act at the
protein and RNA levels, and regulatory elements that control cells and
circumstances in which a gene is active.
ENCODE
data are now available for the entire human genome - All
ENCODE data are free and available for immediate use via :
To
search for ENCODE data related to your area of interest and set up a
browser view, use the UCSC Experiment Matrix or Track Search tool (Advanced features). The Experiment List (Human) and Experiment List
(Mouse) links
provide comprehensive listings of ENCODE data that is released or in
preparation.
All
ENCODE data is freely available for download and analysis. However,
before publishing research that uses ENCODE data, please read the ENCODE Data Release Policy, which
places some restrictions on publication use of data for nine months
following data release. Read more about ENCODE data at UCSC.
|
|
|
|
About ENCODE Data at
UCSC
ENCODE
investigators employ a variety of assays and methods to identify
functional elements. The discovery and annotation of gene elements is
accomplished primarily by sequencing RNA from a diverse range of
sources, comparative genomics, integrative bioinformatic methods, and
human curation. Regulatory elements are typically investigated through
DNA hypersensitivity assays, assays of DNA methylation, and chromatin
immunoprecipitation (ChIP) of proteins that interact with DNA,
including modified histones and transcription factors, followed by
sequencing (ChIP-Seq).
To access the human ENCODE data, open the
Genome Browser, select the February 2009 assembly
(GRCh37/hg19) or the March 2006 assembly (NCBI36/hg18) of the human
genome, and go to your region of interest. The bulk of the ENCODE data
can be found in the Expression and Regulation track groups, with a few
in the Mapping, Genes, and Variation groups. Although most
participating research groups have provided several tracks, generally
only selected data from each research group are displayed by default.
Click the hyperlinked name of a particular track to display a page
containing configuration options and details about the methods used to
generate the data. See the Genome Browser User's Guide for further
information about displaying tracks and navigating in the Genome
Browser.
Data from the
earlier ENCODE project pilot phase, which covered approximately 1% of
the genome, are available on the March 2006 (NCBI36/hg18), May
2004 (NCBI35/hg17), and July 2003 (NCBI34/hg16) human genome
assemblies. The ENCODE Pilot Project web pages provide convenient
browser access to these regions.
|

Credits: Darryl Leja (NHGRI), Ian Dunham (EBI),
Michael Pazin (NHGRI)
|
|
ArrayExpress - functional genomics data
https://www.ebi.ac.uk/arrayexpress/
ArrayExpress is a database of functional genomics experiments that can
be queried and the data downloaded. It includes gene expression data
from microarray and high throughput sequencing studies. Data is
collected to MIAME and MINSEQE standards. Experiments are submitted
directly to ArrayExpress or are imported from the NCBI GEO database.
|
|
 |
What is ArrayExpress?
ArrayExpress is a core EBI database delivered by the Functional
Genomics group. The database is a repository for functional genomics
data from both microarray and high-throughput sequencing studies, many
of which are supported by peer-reviewed publications. Data sets are
either submitted directly to ArrayExpress and curated by a team of
specialist biological curators, or are imported systematically from the
NCBI Gene Expression Omnibus database on a weekly basis. Whichever the
source, data are collected in conformity to the "Minimum Information
About A Microarray Experiment" (MIAME) and "Minimum Information About a
Sequencing Experiment" (MINSEQE) standards.
Publications
/ how to cite
|
|
FANTOM
http://fantom.gsc.riken.jp/
|
|

|
FANTOM is an
international research consortium established by Dr.
Hayashizaki and his colleagues in 2000 to assign functional annotations
to the full-length cDNAs that were collected during the Mouse
Encyclopedia Project at RIKEN. FANTOM has since developed and
expanded
over time to encompass the fields of transcriptome analysis. The object
of the project is moving steadily up the layers in the system of life,
progressing thus from an understanding of the ‘elements’ - the
transcripts - to an understanding of the ‘system’ - the transcriptional
regulatory network, in other words the ‘system’ of an individual life
form.
Mouse over the image on the right hand side
for information
on FANTOM history and publications. ===>>>>
Simultaneously with producing data, FANTOM established the FANTOM
database and the FANTOM full-length cDNA clone bank, which are
available worldwide. The FANTOM resources have been used in several
important research projects. For instance, the full-length cDNA
database was used in a computer prediction of the genomic position
(transcriptional unit) of genes by the International Human Genome
Sequencing Consortium. Also they have been used by a research group led
by Dr. Shinya Yamanaka at Kyoto University, Japan, for establishing
Induced pluripotent stem (iPS) cells. In the study, 24 transcription
factors were selected from FANTOM database as candidate initiation
factors. Furthermore, the Allen Institute for Brain Science in the
United State has created a digital atlas that encompasses the whole
brain, and has made it publicly available. The atlas graphically
illustrates the expression of genes within the mouse brain using
Informatix software. This project has also made use of the FANTOM
database.
|
|
 |
Link to all FANTOM publications from phase
1 - 5
|
|
|
|
FANTOM5 releases
atlas of human gene expression
http://fantom.gsc.riken.jp/5/
|
|
FANTOM, a large
international consortium led by RIKEN releases today the first
comprehensive map of gene activity across the human body, and provides
the first holistic view of the complex networks that regulate gene
expression across the wide variety of cell types that make up a human
being. These findings will help in the identification of genes involved
in disease and the development of personalized and regenerative
medicine.
After many years of concerted effort to
systematically analyze the expression of genes in all human cells and
tissues, RIKEN and the FANTOM consortium publish the findings today in
two landmark Nature reports, and 16 related articles in ten other
scholarly journals (ref.1,2,3).
The papers published in Nature describe maps of
promoters and enhancers – short regions of DNA that influence the
activity of genes - encoded in the human genome, and their activity
across the vast wealth of human cell types and tissues of the human
body. Together with the other studies published by FANTOM5, this data
provides the first complete view of the networks regulating
transcription across all cell types.
|
|

|
The FANTOM project
(for Functional Annotation of the Mammalian
genome) is a RIKEN initiative launched in 2000 to build a complete
library of human genes using the capabilities offered by new,
state-of-the-art cDNA technologies. Over 250 experts in primary cell
biology and bioinformatics from 114 institutions based in more than 20
countries and regions worked as part of FANTOM 5, the 5th edition of
the project, to produce the 18 studies published today.
Using a highly sensitive technique called Cap
Analysis of Gene
Expression (CAGE), developed at RIKEN (ref. 4, 5), the researchers
monitored the activity of promoters and enhancers across over 180 human
primary cells. They identified 180,000 promoters and 44000 enhancers on
the genome and find that the activity of the large majority of these
transcriptional regulation regions is highly specific to cell type.
“Humans are complex multicellular organisms composed
of at least
400 distinct cell types. This beautiful diversity of cell types allow
us to see, think, hear, move and fight infection yet all of this is
encoded in the same genome. The difference between all these cells is
what parts of the genome they use – for instance, brain cells use
different genes than liver cells, and therefore they work very
differently. In FANTOM5, we have for the first time systematically
investigated exactly what genes are used in virtually all cell types
across the human body, and the regions which determine where the genes
are read from the genome,” explains Dr. Alistair Forrest, scientific
coordinator of FANTOM5.
Unlike other large-scale genomics projects,
FANTOM5 focused on
identifying gene expression on normal primary cells rather than cell
lines derived from cancers. “In FANTOM5 we made the decision early on
that we should include a large focus on normal primary cells and
tissues. Although cell lines are easy to use, they are seldom good
models of normal cells, ” said Dr. Forrest.
|
|
A key discovery on the way was that by employing
CAGE, the
technology used to find active genes, the team could identify the
additional DNA regions that regulate the activity of genes in every
cell type, called enhancers. “We found that CAGE is a lot more specific
than competing methods, and still can be used on small cell samples –
this has a huge potential, because it opens up the door for analyzing
tissue samples from people suffering from disease and find out what is
wrong on a molecular level,” said Professor Albin Sandelin, one of the
coordinators for the enhancer project.
“What is written in the genome? Answering this
question has been
the consortium’s ultimate goal since the beginning. The basic library
of cell definition that was produced during FANTOM5 is a remarkable
step to manipulating cells. The library will be an essential resource
for developing a wide rage of technologies for the life sciences, that
will lead to the development of regenerative and personalized medicine
in the near future,” Dr. Yoshihide Hayashizaki, the general Director of
FANTOM said.
“Omics science, the study and systematic mapping of
the
molecules that make up an organism, has yielded one insightful surprise
after another. Life, however, remains largely elusive. We will continue
to search for the basic molecular mechanism underlying the wide
diversity of cells, to provide deeper insights into life science that
will lead to improved medical treatment, “ Dr. Hayashizaki added. |
References
- Forrest
A.R.R. et al. A promoter level mammalian expression atlas. Nature
(2014) http://dx.doi.org/ 10.1038/nature13182
- Andersson,
R. et al. An atlas of active enhancers across human
cell types and tissues. Nature (2014)
http://dx.doi.org/10.1038/nature12787
- Kanamori-Katayama,
M. et al. Unamplified cap analysis of gene
expression on a single-molecule sequencer. Genome Res. 21, 1150–1159
(2011)
|
|
|
Nature Reviews Molecular
Cell Biology 8, 946 (2007)
http://fly-fish.ccbr.utoronto.ca
About
Fly-FISH
|
|

|
| Contrary
to
expectations, many Drosophila melanogaster
mRNA transcripts appear to be localized prior to translation, report
Henry Krause and colleagues in Cell.Localization
of mRNA before translation offers some advantages over immediate
translation — for example, several rounds of translation can occur at a
subcellular location, bypassing the energetically costly need to move
proteins individually. However, estimates had predicted that only 1–10%
of mRNA transcripts are localized prior to translation.To
test these estimates, researchers used
high-resolution fluorescent in situ
hybridization (FISH) to analyse 2,314 embryonically expressed D. melanogaster mRNAs. Strikingly, 71% of the
embryonically expressed mRNAs were specifically localized.mRNA
transcripts localized into 35
categories, including subembryonic categories and subcellular
categories. Given the diversity and frequency of the localization
patterns observed, and given the close correlation between mRNA
localization and protein translation, the authors propose that many, if
not most, cellular functions are regulated by mRNA localization. For
example, the fact that the temporal localization of anillin
mRNA, which encodes an actin-interacting protein, resembles subsequent
actin-filament distribution suggests that mRNA localization is involved
in the organization of cytoskeletal networks. To make the most of
their extensive data, the Krause team catalogued their findings on Fly-FISH,
which is searchable by genes and localization categories. As such, it
offers promise for various lines of inquiry. For instance, the
spatio–temporal data it contains may provide insight into gene
regulatory networks, and the ability to assess mRNA localization with
colocalization of other mRNAs and proteins may help to uncover the
functions of uncharacterized genes. |
|
ALLEN BRAIN ATLAS
A growing collection of online public resources
integrating extensive gene expression and neuroanatomical data,
complete with a novel suite of search and viewing tools. Get started with
tutorials offering introductory overviews and guided tours!
|
|
WELCOME
to EMAP - The e-Mouse Atlas Project
|

|
|

|
EMA, the e-Mouse Atlas
A 3-D anatomical atlas of mouse embryo
development including detailed histology. EMA includes the EMAP
ontology of anatomical structure
|
|
EMAGE,
the e-Mouse Atlas of Gene Expression
A
database of mouse
gene expression where, uniquely, the gene expression is mapped into the
EMA 3-D space and can be queried spatially
|
|
RNA and the Regulation of Gene Expression -
A Hidden Layer of Complexity
Publisher: Caister Academic Press
Edited by: Kevin V. Morris
The Scripps Research Institute, La Jolla, USA
Publication date: March 2008
ISBN: 978-1-904455-25-7
The role of RNA in regulating gene expression has become a topic of
intense interest. In this book internationally recognized experts in
RNA research explore and discuss the methods whereby RNA can regulate
gene expression with examples in yeast, Drosophila, mammals, and viral
infection, and highlight the application of this knowledge in
therapeutics and research. Topics include: gene silencing and gene
activation, the hammerhead ribozyme, epigenetic regulation, RNAi,
microRNA, and pyknons. This comprehensive publication is intended for
readers with teaching or research interests in RNA, the regulation of
gene expression, genetics, genomics or molecular biology.
Reviews:
"the contributions in this book
do
provide informative and well-structured overviews of current
understanding of the roles of non-coding RNAs, short interfering RNAs,
microRNAs and retrotransposons in eukaryotic organisms ... cutting edge
studies on the potential role of RNA species in the epigenetic
regulation of gene expression and on the existence of previously
unidentified classes of intergenic and intronic short regulatory RNAs
(pyknons) ... a useful purchase for specialist workers in the field as
well as for many institutional libraries." from Microbiology Today
(2008)
"This book is a well-selected
compilation of 14 mostly review-style articles, written by experts in
the field ... a well-written, successful endeavour to present the field
of eukaryal RNA-mediated regulation of gene expression. It has its
major strength in providing an extremely well structured, up-to-date,
comprehensive overview that skillfully zooms the reader into each topic
from a general introduction to a high degree of detail ... suited for a
broad range of readers, from advanced students to researchers in the
field. Personally, we very much enjoyed reading it." from ChemBioChem
(2008) 9: 2005-2007
Content:
Chapter 1 The Hammerhead Ribozyme Revisited: New
Biological
Insights for the Development of Therapeutic Agents and for Reverse
Genomics Applications
Justin Hean and Marc S. Weinberg
Chapter 2 Epigenetic Regulation of Gene Expression
Kevin V. Morris
Chapter 3 The Role of RNAi and Noncoding RNAs in Polycomb Mediated
Control of Gene Expression and Genomic Programming
Manuela Portoso and Giacomo Cavalli
Chapter 4 Heterochromatin Assembly and Transcriptional Gene Silencing
under the Control of Nuclear RNAi: Lessons from Fission Yeast
Aurélia Vavasseur, Leila Touat-Todeschini and André Verdel
Chapter 5 RNA-Mediated Gene Regulation in Drosophila
Harsh H. Kavi, Harvey R. Fernandez, Weiwu Xie and James A. Birchler
Chapter 6 MicroRNA-Mediated Regulation of Gene Expression
Lena J. Chin and Frank J. Slack
Chapter 7 Viral Infection-Related MicroRNAs in Viral and Host Genomic
Evolution
Yoichi R. Fujii and Nitin K. Saksena
Chapter 8 Regulation of Mammalian Mobile DNA by RNA-Based Silencing
Pathways
Harris Soifer
Chapter 9 The Role of Non-Coding RNAs in Controlling Mammalian RNA
Polymerase II Transcription
Stacey D. Wagner, Jennifer F. Kugel and James A. Goodrich
Chapter 10 Pyknons as Putative Novel and Organism-Specific Regulatory
Motifs
Isidore Rigoutsos
Chapter 11 RNA-Mediated Recognition of Chromosomal DNA
David R. Corey
Chapter 12 RNA Mediated Transcriptional Gene Silencing: Mechanism and
Implications in Writing the Histone Code
Kevin V. Morris
Chapter 13 Small RNA-Mediated Gene Activation
Long-Cheng Li
Chapter 14 Therapeutic Potential of RNA-mediated Control of Gene
Expression: Options and Designs
Lisa Scherer and John J. Rossi
Global Analysis of
mRNA Localization Reveals a Prominent Role
in Organizing Cellular
Architecture and Function
Eric Lécuyer, Hideki Yoshida, Neela Parthasarathy,
Christina Alm, Tomas Babak, Tanja Cerovina, Timothy R. Hughes, Pavel
Tomancak and Henry M. Krause

Although subcellular
mRNA trafficking has been demonstrated as a
mechanism to control protein distribution, it is generally believed
that most protein localization occurs subsequent to translation. To
address this point, we developed and employed a high-resolution
fluorescent in situ hybridization procedure to comprehensively evaluate
mRNA localization dynamics during early Drosophila embryogenesis.
Surprisingly, of the 3370 genes analyzed, 71% of those expressed encode
subcellularly localized mRNAs. Dozens of new and striking localization
patterns were observed, implying an equivalent variety of localization
mechanisms. Tight correlations between mRNA distribution and subsequent
protein localization and function, indicate major roles for mRNA
localization in nucleating localized cellular machineries. A searchable
web resource documenting mRNA expression and localization dynamics has
been established and will serve as an invaluable tool for dissecting
localization mechanisms and for predicting gene functions and
interactions.
RNA
Quality Control in Eukaryotes
Meenakshi K. Doma, and Roy Parker
Department of Molecular and Cellular Biology and Howard
Hughes Medical Institute, University of Arizona, Tucson, AZ 85721, USA2
HMI and Division of Biology, Mail Code 156-29, California
Institute of Technology, 1200 E. California Blvd., Pasadena, CA 91125
Cell 131, November 16, 2007
Eukaryotic
cells contain
numerous RNA quality-control systems that are important for shaping the
transcriptome of eukaryotic cells. These systems not only prevent
accumulation of nonfunctional RNAs but also regulate normal mRNAs,
repress viral and parasitic RNAs, and potentially contribute to the
evolution of new RNAs and hence proteins. These quality-control
circuits can be viewed as a series of kinetic competitions between
steps in normal RNA biogenesis or function and RNA degradation
pathways. These RNA quality-control circuits depend on specific adaptor
proteins that target aberrant RNAs for degradation as well as the
coupling of individual steps in mRNA biogenesis and function.
Nature
- January 2007 - Focus on RNA
RNA has occupied a
pivotal position in the 'central dogma' of molecular
biology, which states that information flows from DNA through RNA to
proteins. In this issue, we feature a collection of articles that
discuss the diverse functional roles of RNA in biological systems and
highlight recent discoveries in RNA chemical biology, including
advances in transcription, RNA structural biology, RNA interference and
RNA engineering.
http://www.nature.com/nchembio/focus/rna/index.html
- Chemical crosshairs
on the central dogma - Aseem Z Ansari
- RNA learns from
antisense - David R Corey
- RNA at Santa Cruz -
Mirella Bucci
- Synthetic RNA
circuits - Eric A Davidson and Andrew D Ellington
- Natural expansion of
the genetic code - Alexandre Ambrogelly, Sotiria Palioura and Dieter
Söll
- Slicer and the
Argonautes - Niraj H Tolia and Leemor Joshua-Tor
RNA
Analysis Tools
Quantitative
Analysis of Nucleic Acids - the Last Few Years of Progress
Chunming
Ding* and Charles R. Cantor*,†
*Bioinformatics
Program and Center for Advanced Biotechnology, Boston University,
Boston, Massachusetts 02215, USA
†SEQUENOM
Inc., San Diego, California 92121, USA
Journal
of Biochemistry and Molecular Biology, Vol. 37, No. 1, January 2004,
pp. 1-10
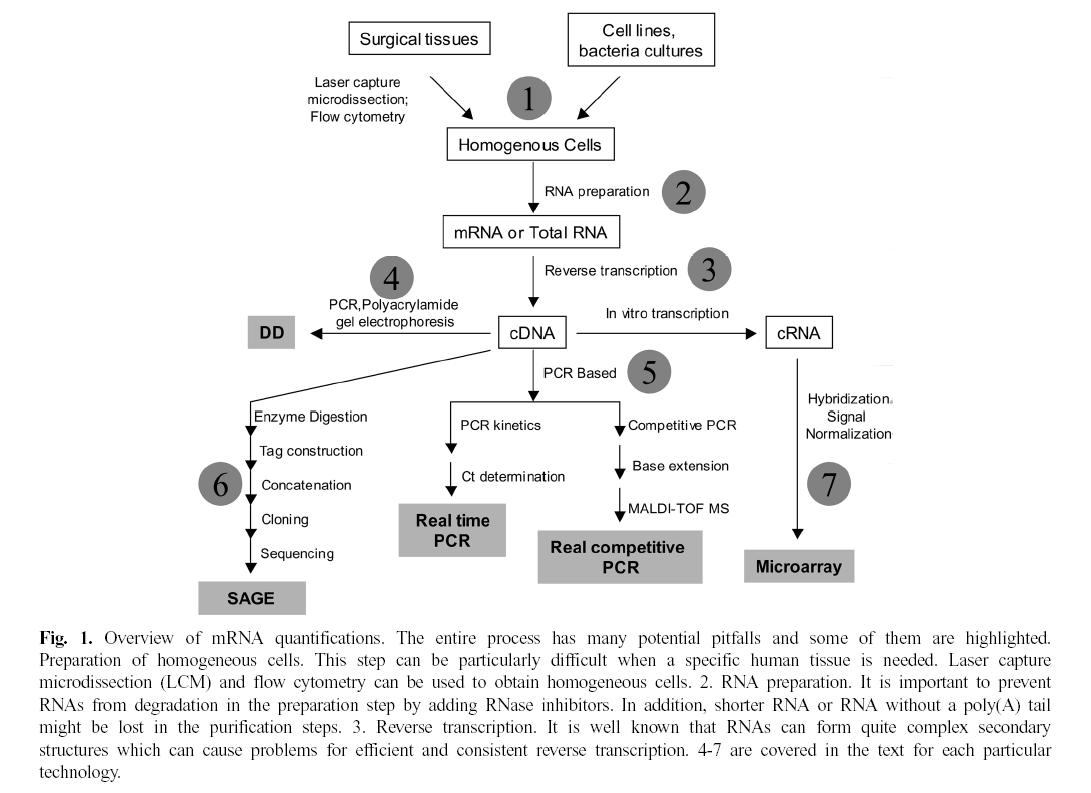
DNA and RNA quantifications are widely used in biological and
biomedical research. In the last ten years, many technologies have been
developed to enable automated and high-throughput analyses. In this
review, we first give a brief overview of how DNA and RNA
quantifications are carried out. Then, five technologies (microarrays,
SAGE, differential display, real time PCR and real competitive PCR) are
introduced, with an emphasis on how these technologies can be applied
and what their limitations are. The technologies are also evaluated in
terms of a few key aspects of nucleic acids quantification such as
accuracy, sensitivity, specificity, cost and
throughput.
|
|
|
 |

|
external
links:
Intra-
and Interspecific
Variation in Primate Gene
Expression Patterns
Enard et
al. (2002) Science 296 (5566): 340-343
Although humans and their
closest evolutionary relatives,
the chimpanzees, are 98.7% identical in their
genomic DNA sequences, they
differ in many morphological, behavioral, and cognitive aspects.
The underlying
genetic basis of many of these differences
may be altered gene expression. We havecompared
the transcriptome in
blood leukocytes, liver, and brain of humans, chimpanzees, orangutans,and macaques using microarrays,
as well as protein expression patterns of humans and chimpanzees using two-dimensional gel
electrophoresis. We also studied three mouse species that are
approximately as related to each other as are
humans, chimpanzees, and
orangutans. We identified species-specific gene
expression patterns
indicating that changes in protein and gene expression have been
particularly pronounced
in the human
brain.

Gene
expression
by M.Tevfik
Dorak, MD, PhD
http://dorakmt.tripod.com/genetics/realtime.html
Genes are transcribed from
5' to the 3' of the sense
strand via RNA polymerases. It is actually the antisensetemplate strand, which is
transcribed (3' to 5') and gives a strand identical to the sense
strand. It is possiblethat a gene is encoded on
the sense strand and another
one on the anti-sense strand in opposite direction
(example). Also possible is
the overlapping genes which are frequent in viruses and plasmid/phages.
Regions
relevant in gene expression.
Enhancers: A
sequence on either side of the gene
(cis-acting = on the same chromosome) that stimulates a specific promoter. It is
not transcribed.
Promoters: A sequence(s) in the close vicinity of the transcription
initiation site 5' (upstream) to the gene. It maybe
a general (cis-acting) or
tissue/cell-specific one (cis-, or trans-acting = on a different
chromosome). Initial binding site for RNA
polymerase. Transcription factors bind
to the promoters and allow RNA polymerase to act. The promoter is not transcribed
itself. The common promoters, TATA and CAAT boxes, are found about
30 bp and 75
bp, respectively, upstream of the transcription initiation site.
Transcription initiation (cap)
site: This is where
the transcription of DNA to immature (precursor) pre-mRNA(nuclear RNA or nRNA) starts.
It is immediately 5' to the gene. This sequence adds a 7-methylated GTP
cap to the
beginning of the mRNA (to protect it against the activity of
5'-exonuclease). From here to the translation initiation
site, the sequence
codes for the 5'-untranslated or UT (ribosome-binding) region and the
signal peptide.
The 5'-UT region is transcribed but not translated. It contains the
site (the leader sequence) at which ribosomes
initially bind to
mRNA to start translation.
The signal sequence is translated at the N-terminal and directs the protein to its
correct cellular location (endoplasmic reticulum, Golgi apparatus, cell
membrane, etc) or outside the cell through the
cell membrane, and is finally
removed at the final destination. The events that occur to mRNA before it leaves the
nucleus are collectively called RNA processing or post-transcriptional
modification (capping,
polyadenylation and splicing).
Translation
initiation site (ATG): This sequence represents the beginning
(N-terminal) of translated protein. [5' of DNA
codes for N-terminal of
a polypeptide]. It codes for a methionine but methionine is
subject to post-translational
elimination most of the time. Thus, each mature mRNA's first codon is
for methionine (AUG) but not all polypeptides
start with methionine. Translation
takes place in the ribosome in the cytoplasm.
Exon-intron boundaries: Each intron starts with GpT and
ends with ApG. The introns are subject to splicing out (post-transcriptional
modification which also includes 5' capping and 3' polyadenylation).
Although they are not represented in the
resultant
polypeptide, they may contain some regulatory sequences.
Stop codon: One of the three codons marks the end of
transcription.
The triplet before this codes for the last amino
acid of a polypeptide
chain (C-terminal). [3' of DNA codes for C-terminal of a
polypeptide.)
Intranslated Regions (UTRs): 5' UTR usually contains gene- or
developmental stage-specific and common regulators
of expression
(motifs, boxes, response or binding elements) , and 3' UTR is also
involved in gene expression although it does
not contain well-known
transcription control sites. 3' UTR
sequences (called cytoplasmic polyadenylation
elements or adenylation control
elements) can control the nuclear
export, polyadenylation
status, subcellular targeting and rates of translation and degradation
of mRNA. The involvement of 3' UTR is well
documented in controlling male and female
gametogenesis and in early embryonic development.
Myotonic dystrophy
is a disease caused by the expansion of the triplet repeats in the 3'
UTR of a protein
kinase gene.
Polyadenylation signal: This sequence is immediately after
(downstream
to) the stop codon and codes for a poly-A tail
which varies in
length. It is in the 3' untranslated region (histone mRNAs lack poly-A
tail). Poly(A) tail is believed to stimulate
translation initiation whereas its
shortening triggers entry of mRNA
into the decay pathway. Position effect or tissue/cell-specific
expression of genes in gene therapy depend on the effects of enhancers and
promoters. The
triplets on the DNA are transcribed to codons on mRNA
[in the nucleus] and after splicing out intronic sequences,
the codons are read
by anti-codons of tRNA to be translated to amino acids. After various
post-translational
modifications (which may include phosphorylation, glycosylation, etc),
a protein
is made. Thus, the stages of protein synthesis
are: transcription, splicing (nuclear processing), translation and
post-translational
modifications. See also paramutation
(paramutation
is an allelic interaction that results in meiotically heritable changes
in gene expression),
methylation, genomic imprinting and allelic exclusion (glossary). Such
epigenetic
changes and especially
their heritability are one of the very hot debates of recent years (see
Hidden Inheritance by G Vines in New Scientist,
28 Nov 1998,
pp.27-30; Epigenetics: Special Issue of Science, 2001). The National
Fragile X
Foundation website explains the molecular basis of a well-known
epigenetic disease, fragile X syndrome. Common
techniques to measure gene expression are Northern blotting,
ribonuclease
protection assay and reverse-transcription (RT)
PCR. These are briefly described below.
Overview:
Gene Structure
Talks
presentations
from David Wishart, Departments of Computing
Science and Biological Sciences,
University
of Alberta,
Edmonton, Alberta; USA:
Genes and Gene Expression
The gene is the
fundamental unit of inheritance and the ultimate determinant of all
phenotypes. The DNA of a normal human cell contains an estimated 50 to
100,000
genes, but only a fraction of these are used (or “expressed”) in any
particular cell at any given time. For example, genes specific for
erythroid cells, such as the hemoglobin genes, are not expressed in
brain cells. According
to the “central dogma” of molecular biology,
a gene exerts its effects by having its DNA “transcribed” into a
messenger
RNA (mRNA), which is, in turn, “translated” into a protein, the final
effector of the gene's action. Thus, molecular biologists often
investigate
gene “expression” or “activation,” by which is meant the process of
transcribing DNA into RNA, or translating RNA into protein. The process
of transcription involves creating a perfect RNA copy of the gene using
the DNA of the gene as a “template.” Translation of mRNA into protein
is a somewhat more complex process, since the structure of the gene's
protein is “encoded” in the mRNA, and that structural message must be
decoded during translation.

Functional Components of the
Gene
Every
gene consists of several functional components, each involved in a
different facet of theprocess of gene expression
(Figure A). Broadly speaking,
however, there are two main functional units: the “promoter” region and
the “coding” region. The promoter region controls when and in what
tissue a gene is expressed. For example, the promoter of the hemoglobin
gene is responsible for its expression in erythroid cells and not in
brain cells. How is this tissue-specific expression achieved? In the
DNA of the gene's promoter region, there are specific structural
elements, “nucleotide sequences” (see “Structural Considerations”
below), that
permit the gene to be expressed only in an appropriate cell. These are
the elements in the hemoglobin gene that instruct an erythroid cell to
transcribe hemoglobin mRNA from that gene. These structures are
referred to as “cis”-acting elements because they reside on the same
molecule of DNA as the gene. In some cases, other tissue type-specific
“cis”-acting elements, called “enhancers,” reside on the same DNA
molecule, but at great distances from the coding region of the gene. In
the appropriate cell,
the “cis”-acting elements bind protein factors that are physically
responsible for transcribing the gene. These proteins are called
“trans”-acting factors because they reside in the cell's nucleus
separate from the DNA molecule bearing the gene. For example, brain
cells would not have the right “trans”-acting factors that bind to the
hemoglobin promoter, and therefore brain cells would not express
hemoglobin. They would, however, have “trans”-acting
factors that bind to neuron-specific gene promoters.
Figures: Gene
expression. A gene's DNA is transcribed into mRNA which is, in turn,
translated into protein. The functional components of a gene are
schematically diagramed here. Areas of the gene destined to be
represented in mature mRNA are called exons, and intervening areas of
DNA between exons are called introns. The portion of the gene that
controls transcription, and thereforeexpression, is the promoter. This
control is exerted by specific nucleotide sequences in the promoter
region (so-called “cis”-acting factors) and by proteins (so-called
“trans”-acting factors) that must interact with promoter DNA and/or RNA
polymerase II in order for transcription to occur. The primary
transcript is the RNA molecule made by RNA polymerase II that
iscomplementary to the entire stretch of DNA containing the gene.
Before leaving the nucleus, the primary transcript is modified by
splicing together exons (thus removing intron sequences), adding a cap
to the 5´ end, and adding a poly-A tail to the 3´ end. Once
in the cytoplasm, mature mRNA undergoes translation to yield a protein.


The structure
of a
gene's protein is specified by the gene‘s “coding” region. The coding
region contains the information that directs an erythroid cell to
assemble amino acids in the proper order to make the hemoglobin
protein. How is this order of amino acids specified? As described in
detail below, DNA is a linear polymer consisting of four
distinguishable subunits called nucleotides. In the coding region of a
gene, the linear sequence of nucleotides “encodes” the amino acid
sequence of the protein. This genetic code is in triplet form so that
every
group of three nucleotides encodes a single amino acid. The 64 triplets
that
can be formed by four nucleotides exceeds the number of amino acids
used
to make proteins (20). This makes the code degenerate and allows some
amino
acids to be encoded by several different triplets. The nucleotide
sequence of any gene can now be determined (see below). By translating
the code, one can derive a predicted amino acid sequence for the
protein encoded by a gene.
Structural
Considerations
Fine Structure
The basic
repeating units of the DNA polymer are nucleotides (Figure B).
Nucleotides consist of an invariant portion, a five-carbon deoxyribose
sugar with a phosphate group, and a variable portion, the “base.” Of
the four bases that appear in the nucleotides of DNA, two are purines,
adenine (A) and guanine (G), and two are pyrimidines, cytosine (C) and
thymine (T). Nucleotides are connected to each other in the polymer
through their phosphate groups, leaving the bases free to interact with
each other
through hydrogen bonding. This “base pairing” is specific, so that A
interacts with T, and C interacts with G. DNA is ordinarily
double-stranded, that is, two linear polymers of DNA are aligned so
that the bases of the
two strands face each other. Base pairing makes this alignment specific
so that one DNA strand is a perfectly complementary copy of the other.
In every strand
of a DNA polymer, the phosphate substitutions alternate between the
5´ and 3´ carbons of the deoxyribose molecules. Thus, there
is a directionality to DNA: the genetic code reads in the 5´ to
3? direction.
In double-stranded DNA, the strand that carries the translatable
code in the 5´ to 3´ direction is called the “sense”
strand, while its complementary partner is the “antisense” strand.
Figures: Structure
of base-paired,
double-stranded DNA. Each strand of DNA consists of a backbone of
5-carbon deoxyribose sugars connected to each other through phosphate
bonds. Note that as one follows the sequence down the left-hand strand
(A to C to G to T), one is also following the carbons of the
deoxyribose ring, going from the 5´ carbon to the 3´
carbon. This is the basis for the 5´ to 3´ directionality
of DNA. The 1´ carbon of each deoxyribose is substituted with a
purine or pyrimidine base. In double-stranded DNA, bases face each
other in the center of the molecule and base-pair via hydrogen bonds
(dotted lines). Base-pairing is specific so that adenine pairs with
thymine, and guanine pairs with cytosine.


Gross Structure
In eukaryotes, the coding
regions of most genes are not
continuous. Rather, they consist of areas that are transcribed into
mRNA, the “exons,” which are interrupted by stretches of DNA that do
not appear in mature mRNA, the “introns” (see Figures above). The
functions of introns are not known with certainty. A purpose of some
sort is implied by their conservation in evolution. However, their
overall physical structure might be more important than their specific
nucleotide sequences, since the nucleotide sequences of
introns diverge more rapidly in evolution than do the sequences of
exons. Overall, DNA that contains genes comprises a minority of total
DNA. Between genes, there are vast stretches of untranscribed DNA that
are assumed to play an important structural role. In the nucleus, DNA
is not present
as naked nucleic acid. Rather, DNA is found in close association with a number of
accessory proteins, such as the histones, and in this form is called
chromatin. Although many of DNA's accessory proteins have no known
specific function, they generally appear to be involved in the correct
packaging of DNA. For example, DNA's double helix is ordinarily twisted
on itself to form a supercoiled structure. This structure must unwind
partially during DNA replication and transcription. Some of the
accessory proteins, for example, topoisomerases and histone acetylases,
are involved in regulating this process.
Summary
Genes specify
the structure of proteins that are responsible for the phenotype
associated with a particular gene. While the nucleus of every human
cell contains 30 to 40,000 genes, only a fraction of them are expressed
in any given cell at any given time. The “promoter” (with or without an
“enhancer”) is the part of the gene that determines when and where it
will be expressed. The “coding region” is the part of the gene that
dictates the amino
acid sequence of the protein encoded by the gene. DNA is a linear
polymer of nucleotides. Ordinarily, the nucleotide bases of one strand
of DNA interact with those of another strand (A with T, C with G) to
make double-stranded DNA. In the cell's nucleus, DNA is associated with
accessory proteins to make the structure called chromatin.


mRNA
Transcript Analysis
Structural Considerations
The first step in gene
expression is transcription of the
genetic information in DNA into RNA. The individual building blocks of
RNA, ribonucleotides, have the same structure as the
deoxyribonucleotides in DNA, except that (1) the 2' carbon of the
ribose sugar is substituted with an OH group instead of H; and (2)
there are no thymine bases in RNA, only uracil (demethylated thymine),
which also pairs with adenine by hydrogen bonding. Just like the DNA
polymerases described above, the enzyme RNA polymerase II uses the
nucleotide sequence of the gene's DNA as a template to form a polymer
of ribonucleotides with a sequence complementary to the Dna
template.
In order for
transcription to be “correct,” RNA polymerase II must use the antisense
strand of DNA as a template, begin transcription at the start of the
gene,
and end transcription at the end of the gene. The signals that ensure
correct transcription are provided to the RNA polymerase II by DNA
in the form of specific nucleotide sequences in the promoter of the
gene. After reading and interpreting these signals, the RNA polymerase
generates a primary RNA transcript that extends from the initiation
site
to the termination site in a perfect complementary match to the DNA
sequence
used as a template. However, not all transcribed RNA is destined to
arrive
in the cytoplasm as mRNA. Rather, by an incompletely understood
process,
sequences complementary to introns (see above) are excised from the
primary
transcript, and the ends of exon sequences are joined together in a
process
termed “splicing.”
In addition to
splicing, the primary transcript is further modified by the addition of
a
methylated GTP “cap” at the 5´ end, and the addition of a
stretch of anywhere from 20 to 40 A bases at the 3´ end. These
modifications appear to promote the “translatability” and relative
stability of mRNAs and help direct the subcellular localization of
mRNAs
destined for translation.


Northern
Blotting
The fundamental
question in the analysis of gene expression at the RNA level is whether
RNA sequences derived from a gene of interest are present in cells
or tissues. Detecting specific RNA sequences can be accomplished
by Northern blotting, the whimsically named analogue of Southern
blotting,
when applied to RNA analysis. RNA can be isolated from cells in its
intact
form, free from significant amounts of DNA. Messenger RNA is much
smaller
than genomic DNA, so it can be analyzed by agarose gel electrophoresis
without the enzymatic digestion steps that are necessary for the
analysis
of high molecular weight DNA. RNA is single stranded and has a tendency
to fold back on itself. This allows complementary bases on the same
stretch of RNA to base-pair with each other and form what is termed
“secondary structure.” Because secondary structure can lead to aberrant
electrophoretic behavior, RNA is electrophoretically separated by size
in the presence of a denaturing agent, such as formaldehyde or
glyoxal/DMSO. After electrophoresis through a denaturing agarose gel,
the RNA is transferred to a nitrocellulose or nylon-based membrane in
the same manner as DNA for Southern blotting (see Figure 1).
Hybridization schemes and blot washing are essentially the same for
Northern blotting as for Southern blotting. In this manner, specific
RNA sequences corresponding to those in cloned DNA probes can easily be
identified.
Poster:
Southern Blot & Northern Blot
Poster Board
Direct
download:
Northern-Blot movie (6.8 MB)
Direct
download:
Southern-Blot movie (1.6 MB)
Figure 1: Genomic
Southern blotting. Genomic DNA is digested with a single restriction
endonuclease resulting in a complex mixture of DNA fragments of
different sizes, that is, molecular weights. Digested DNA is arrayed by
size using electrophoresis through a semisolid agarose gel. Because DNA
is negatively charged, fragments will migrate toward the anode, but
their progress is variably impeded by
interactions with the agarose gel. Small fragments interact less and
migrate farther; large fragments interact more and migrate less. The
arrayed fragments are then transferred to a sheet of nitrocellulose or
nylon-based filter paper by forcing buffer through the gel as shown.
The DNA fragments are carried by capillary action and can be made to
bind irreversibly to thefilter. Now the DNA fragments, still arrayed by
size on the filter, can be probed for specificnucleotide sequences
using a 32P-radiolabeled nucleic acid probe. The probe will hybridize
tocomplementary
sequences in the DNA, and the position of the fragment that contains
these sequences can be
revealed by exposing the filter to x-ray film.

There is a lower limit to
the sensitivity of Northern
blotting, so that only moderately abundant mRNAs can be detected using
this technique. One way to increase the sensitivity of Northern
blotting
is to enrich the RNA preparation for mRNA. Ordinarily, mRNA makes
up less than 10% of the total RNA content of a cell or tissue. When
RNA is isolated from these sources, all RNA species are being isolated,
that is, ribosomal and transfer RNA as well as mRNA. As noted above,
most mRNAs destined for the cytoplasm and translation are modified
by the addition of a 3´ poly(A) tract. An RNA preparation can,
therefore, be greatly enriched for mRNA species by removing all RNA
molecules that lack the 3´ poly(A) tail. This can be done by
exposing the RNA preparation to a tract of poly(U) or poly(T) bound to
an immobilized support, such as a plastic bead. The poly(A) portion of
mRNA will bind to the poly(U) or poly(T) material, and
non–poly(A)-containing RNA can be washed away. After washing, the
poly(A)-containing mRNA can be recovered from the solid support and
used in Northern blot analysis. This procedure improves the sensitivity
of Northern blotting by nearly two orders of magnitude.
A dramatic
use of Northern blotting in cancer research has been the demonstration
of oncogene expression in some human tumors. RNA was isolated from
human tumor samples and analyzed by Northern blotting using cloned DNA
probes derived from various oncogenes. The earliest observations
included expression of c-abl and c-myc in human tumor cell lines and
leukemic blasts. Since then, however, a large number of proto-oncogenes
have been shown to be transcribed in primary human tumor tissue.
Nuclease
Protection Assays (RPA)
Direct
download: RPA
movie (9.4 MB)
Another
technique used in the analysis of mRNA is the nuclease protection
assay. This assay differs from Northern blotting in two general
respects: (1) it is more sensitive than Northern blotting and is
therefore used for the detection of rare mRNA species; and (2) it
provides detailed structural information about the mRNA being analyzed,
and is thus often referred to as “transcript mapping.”
Nuclease
protection assays (Figure 2) use a single-stranded radioactive DNA or
RNA probe. The nucleotide sequence of the probe contains at least some
nucleotides that are complementary to the mRNA being analyzed. The
probe is annealed to the target mRNA by base-pairing, and the regions
of the probe that are complementary to the target mRNA now become
double-stranded, while the noncomplementary regions of the probe remain
single-stranded. The annealed mixture is then subjected to digestion
with an enzyme specific for single-stranded DNA (usually S1 nuclease),
when using a DNA probe, or RNA (usually a mixture of RNase A and RNase
T1), when using an RNA probe. The double-stranded annealed areas resist
digestion, while all the single-stranded noncomplementary parts of the
probe are digested away. In essence, areas in the probe that anneal to
the mRNA are “protected” from digestion by the nucleases. The
surviving, undigested parts of the probe can then be analyzed by
electrophoresis through an agarose or polyacrylamide gel. The amount of
radiolabeled probe resistant to digestion is proportional to the amount
of target mRNA in the sample.
Figure 2: Nuclease
protection
assay. In this example, an mRNA containing a point mutation indicated
by the inverted triangle in the mRNA on the right) is distinguished
from its normal, non-mutated counterpart (mRNA on the left). The mRNA
is mixed with a single-stranded 32P-labeled DNA or RNA probe that (1)
has sequences perfectly complementary to the nonmutated region of
interest in the mRNA, and (2) extends for some length beyond the mRNA.
The mixture is heated then cooled to allow the probe to anneal to its
complementary sequences in the mRNA. The annealed mixture is then
treated with single-strand specific nucleases (S1 nuclease for a DNA
probe, or RNases for an RNA probe). This results in digestion of the
probe at all single-stranded areas: the extension beyond the mRNA
sequences, and the single base-pair mismatch overlying the mutation
(right). The radioactive digestion products are then separated by
electrophoresis through a urea-containing polyacrylamide gel. The probe
that annealed to normal, nonmutated mRNA is smaller than the undigested
probe (by the length of the extended region not complementary to the
mRNA) and will therefore migrate farther than undigested probe. The
probe that annealed to the mutated mRNA will have been digested into
two fragments whose summed length will equal that of the digested probe
that annealed to nonmutated mRNA.

Nuclease
protection assays can also provide structural information about target
mRNA sequences. If there are any mismatches in the sequence of the
target mRNA compared with the probe, the areas corresponding to the
mismatches will generate small single-stranded loops (see Figure 1.11).
Since the nucleases that digest the annealed probe/mRNA hybrid are
specific for single-stranded nucleotides, any mismatches between probe
and target are susceptible to digestion. Thus a mismatch can be
detected if the nuclease-digested radiolabeled probe is smaller than
would have been expected, or when the probe has been digested into
multiple fragments. In fact, by careful measurement of the length of
the digested probe, one can determine exactly where the mismatch has
occurred in the target mRNA.
This technique
has been used to detect single base mutations or small deletions in
cellular mRNAs.
For example, the proposed pathogenetic role of tumor suppressor genes,
such
as p53, in cancer depends on the inactivation of these genes, for
example, by point mutation. Nuclease protection assays have been used
to
demonstrate the presence of point mutations in the mRNA for p53
in primary human lung cancer samples.
cDNA
The flow of
genetic information usually runs from DNA to RNA to protein, according
to the so-called “central dogma” of molecular biology. There are,
however, exceptions to this rule, the most prominent of which involves
the life cycle of retroviruses. These viruses encode their genetic
information in RNA rather than DNA. When they invade a susceptible host
cell, they direct the synthesis of a DNA intermediate that is a
complementary copy of their genomic RNA. The enzyme that accomplishes
this task, reverse transcriptase, is a DNA polymerase (see above) that
uses RNA, rather than DNA, as a template to form a complementary DNA
(cDNA) copy of the RNA. This enzyme can be used in vitro to make cDNA
copies of any available RNA.
One important
application of cDNA synthesis has been the construction of cDNA
libraries,
analogous to the genomic libraries described above (see Figure 3
and 4). A valuable tool for the analysis of gene expression would
be a gene library that consisted only of the genes that were expressed
in a cell or tissue of interest. Most of the time, one is really not
concerned with all the DNA in the genome, for example, intron
sequences,
promoters, and vast regions of “uninformative” DNA that lie between
genes. Furthermore, if one were interested in analyzing the genes
expressed in a brain cell, why bother making a library that contained
sequences for the hemoglobin gene? One way to construct a library
comprising only tissue-specific expressed genes would be to clone all
the mRNA
in a specific cell or tissue of interest. Unfortunately, there is no
way to ligate single-stranded RNA to a double-stranded DNA cloning
vector.
However, one can use all the mRNA in a cell as a template for making
double-stranded cDNA, which can then be inserted into a cloning vector.
Figure 3:
Constructing a genomic
library. Genomic DNA and plasmid DNA are cut with EcoRIin preparation
for cloning, as in Figure 4. (The vector DNA could also be
bacteriophage DNA rather than plasmid DNA). In this case, all of the
variously sized EcoRI-produced genomic DNA fragments are cloned
individually into the EcoRI site of the plasmid, and the recombinant
DNA isintroduced into E.coli by transformation. Transformed bacteria
are selected by growth in thepresence of ampicillin, as in Figure 4.
Since each bacterium can be transformed by only one recombinant
plasmid, and since each colony on the agar plate arose from a single
transformedbacterium, each colony (or clone) contains amplified plasmid
bearing a single genomic EcoRI fragment. Taken together, all the
bacterial colonies represent the entire genetic complement of
theorganism from which the original genomic DNA was isolated. Thus, all
of the clones on all of the plates can be thought of as a genomic
library, with each individual clone representing one volume.

Figure 4: Gene
cloning. In this example, a small amount of foreign DNA (a few
nanograms) is digested with EcoRI. This foreign DNA can come from any
source, the only requirement being that it contains the same
restriction endonuclease recognition sites as the vector. Plasmid
vector is also digested with EcoRI to create a linear DNA molecule. The
“sticky” single-stranded ends of the foreign DNA can align and
base-pair with the complementary “sticky ends” of the plasmid, after
which DNA ligase covalently bonds foreign DNA to plasmid DNA. This
recombinant DNA is introduced into E. coli by a process called
transformation. Since the bacteria themselves are not resistant to
ampicillin, growth in ampicillin will select only those bacteria that
have taken up the plasmid DNA (which carries an ampicillin resistance
gene). The plasmid contains a bacterial origin of replication so that
as the bacterial culture grows, plasmids replicate resulting in several
copies in each bacterium. When the culture has grown to sufficient
size, plasmid DNA can be isolated biochemically, foreign DNA can be cut
from the plasmid using EcoRI, and the resulting yield will often be
milligrams of DNA, that is, greater than a 106-fold amplification.

To make a cDNA
library, one isolates all the mRNA from a cell or tissue. Then, using
this mRNA as a template, reverse transcriptase makes cDNA copies of
each mRNA molecule in the mixture. The cDNA is ligated into a plasmid
or phage vector as described above for genomic libraries, and the
recombinant vectors are introduced into bacteria. After growth on agar
plates, each bacterial colony or phage plaque of a cDNA library houses
a unique recombinant vector containing the cDNA copy of a single mRNA.
Desired clones can be detected by nucleic acid hybridization to the
plaques or colonies using a radiolabeled gene probe. Alternatively, if
the vector containing the
cDNA molecules can direct transcription of mRNA by host bacterial
cells, mRNA will be synthesized, and that mRNA will be translated. In
this case, each bacterial colony or plaque will produce a different
protein, and each protein will have been encoded by an mRNA from the
original cell or tissue being investigated. If an antibody directed
against a protein of interest is available, the cDNA clone
corresponding to the mRNA that encodes that protein can be identified
by binding the antibody to the colonies or plaques of the cDNA library.
This technique, called “expression cloning,” often employs the
bacteriophage ?gt11 as the cloning vector.
cDNA libraries
can be used to clone cDNA for a known gene to discover the sequence of
the mRNA it encodes. Alternatively, these libraries can be used to
identify previously unknown genes. In a process called “differential
screening,” cDNAs can be discovered that owe their existence to a
particular differentiation or activation state in the cell of origin.
For example, this technique has been used to identify genes whose
expression is turned on by hormones or by growth factors. A rapid
modification of this technique using PCR (called “differential
display”) is described in the next section.
DNA
Microarray Analysis
Another
approach to comparative gene expression profiling employs the use of
DNA microarrays, often referred to as DNA “chips.” Two basic types of
DNA microarrays are currently available: oligonucleotide arrays and
cDNA arrays. Both approaches involve the immobilization of DNA
sequences in a gridded
array on the surface of a solid support, such as a glass microscope
slide or silicon wafer. In the case of oligonucleotide arrays,
25-nucleotide long fragments of known DNA sequence are synthesized in
situ on the
surface of the chip using a series of light-directed coupling reactions
similar to photolithography. Using this method, as many as 300,000
distinct
sequences representing over 6,000 genes can be synthesized on a single
1.3 cm × 1.3 cm microarray. In the case of cDNA microarrays, cDNA
fragments are deposited onto the surface of a glass slide using a
robotic
spotting device. For both microarray approaches, the next step involves
the purification of RNA from the source of interest (e.g., from a
tumor),
enzymatic fluorescent labeling of the RNA, and hybridization of the
fluorescently labeled material to the microarray. Hybridization events
are then captured by scanning the surface of the microarray with a
laser
scanning device and measuring the fluorescence intensity at each
position
in the microarray. The fluorescence intensity of each spot on the array
is
proportional to the level of expression of the gene represented by that
spot.
This process is illustrated in Figure 5.
Figure 5: DNA
microarray analysis.
In this example, RNA extracted from a tumor is end-labeled with a
fluorescent marker, then allowed to hybridize to a chip derivatized
with cDNAs or oligonucleotides as described in the text. The precise
location of RNA hybridization to the chip can be determined using a
laser scanner. Since the position of each unique cDNA or
oligonucleotide is known, the presence of a cognate RNA for any given
unique sequence can be determined.

DNA microarray technology
is evolving rapidly, with
improvements in miniaturization, reproducibility, production
capabilities, and the development of alternative approaches to
microarray synthesis. The application of gene expression profiling
methods to important questions in biology and medicine is also
emerging. For example, DNA microarrays have been recently demonstrated
to be useful in understanding the cell cycle, hematopoietic
differentiation, responses to serum stimulation, interferon gamma
treatment, and cancer classification. The ability
to monitor the expression levels of thousands of genes simultaneously
offers the potential opportunity to expand the analysis of cancer
genetics beyond single–candidate gene approaches, toward considering
genetic networks. It is becoming increasingly clear that while some
tumors appear to be caused by mutations in a single gene (e.g.,
oncogene or tumor suppressor gene), most cancers likely arise through
the collaboration of multiple genes, none of which, when considered
alone, are sufficient for transformation. Until recently, the analysis
of such genetic networks has been impractical, in that methods for
measuring the expression levels of multiple genes in parallel have not
been available. The development of DNA microarrays may, in large part,
have solved this problem. Microarrays capable of monitoring the
expression levels of the entire human genome (estimated to contain
approximately 100,000 genes) are likely to become available in the near
future.
The challenge
now is not so much how to generate complex gene expression data, rather
how to interpret it. The key is to develop methods for recognizing
meaningful gene expression patterns and distinguishing those patterns
from noise. Such noise (random gene expression levels) can be generated
by (1) variability among microarrays, (2) variability in RNA labeling
and hybridization methods, and perhaps most importantly, (3) biological
variability among samples. It is likely that all of the above sources
of variability are significant. It has become clear that the
successful elucidation of genetic networks through expression profiling
will
require the expertise of a new generation of scientists, namely,
computational biologists. Improvements in DNA microarray fabrication
will only become valuable
if pattern recognition algorithms are similarly developed. Nonetheless,
it
is likely that the future of cancer diagnostics will include the
analysis of gene expression profiles which might help guide treatment
planning of individual patients.
Polymerase
Chain
Reaction (PCR &
RT-PCR)
real-time qRT-PCR classical
block RT-PCR & competitive
RT-PCR
Roche Applied
Science
- PCR Application Manual 3rd Edition
Another
important use of cDNA technology has allowed PCR to be applied to RNA.
Since the Taq polymerase is a DNA polymerase (see above), it cannot use
RNA
as a template. Simply adding primers and Taq polymerase to an RNA
preparation will not result in amplification. However, if an RNA of
interest could be made into DNA, then PCR would proceed as usual. The
first step in
this analysis is generating a cDNA copy of the mRNA of interest using
reverse transcriptase. This can be done using a primer consisting of
Ts (complementary to the poly(A) tail) or of a sequence complementary
to some portion of the 3´ region of the mRNA. The 5´ primer
can then be added along with Taq polymerase, and the single-stranded
cDNA
made in the first step will be amplified as described above (see Figure
6). In one of the first applications of this technique, Ph' positive
leukemias
were diagnosed by identifying chimeric bcr-abl mRNA species in clinical
material using PCR. Since then, so-called reverse transcriptase (RT)
PCR
has come into widespread use.
Figure 6: Polymerase
chain reaction
(PCR). DNA is mixed with short (10–20 base) single-stranded
oligonucleotide primers that are complementary to the 5´ and
3´ ends of the sequence to be amplified. The mixture is heated to
dissociate or “melt” all double-stranded DNA, and then cooled to permit
the primers to anneal to their complementary sequences on the DNA to be
amplified. Note that the 5´ primer will anneal to the “lower”
strand, and the 3´ primer will anneal to the “upper” strand. A
heat-resistant (thermostable) DNA polymerase (Taq polymerase, see text)
was present in the original mixture, and it now synthesizes DNA by
starting at the primers and using the strands to which the
double-stranded DNA copies for every molecule of double-stranded DNA in
the original mixture. The reaction is then heated to melt
double-stranded DNA, cooled to allow reannealing, and the polymerase
makes new double-stranded DNA again. There are now four double-stranded
DNA copies for each original DNA molecule. This process can be repeated
n times (usually 20–50) to result in 2'' copies of double-stranded DNA.

One inherent
problem in using PCR to monitor mRNA expression is quantitation of the
amplified PCR products. In Northern blotting or nuclease protection
analysis, the intensity of the hybridization signal is directly
proportional to the amount of target RNA in the sample. Thus, one can
compare the number of RNA molecules in one sample with another. With
PCR, a slight change in the efficiency of polymerization in an early
cycle in one sample will lead to a geometrically increasing discrepancy
between the amount of amplified product in that sample compared with
another sample. Fortunately, a number of techniques have been described
for normalizing the products of PCR reactions to allow quantitative
comparisons. In general, they involve amplifying an easily
distinguishable control RNA template in the same
reaction as the RNA of interest. Normalization of the amplified
experimental PCR products to the control products then allows
comparisons to be made. One application of RT-PCR is a simple method
for differential screening (see above) called differential
display. Two cell
populations to be compared are identified, and mRNA is isolated from
both. Reverse transcription and PCR are performed using a poly-T
primer, which will anneal to the 3´ poly-A tail of all the mRNA
species, and a set of primers with random sequences,
which by chance will anneal to sequences upstream of the poly-A tail
in all the mRNA species. Since the upstream primer will anneal at
random
to different mRNA species, the lengths of the PCR products will vary
for nearly every mRNA. If the amplification is performed in the
presence
of radiolabeled nucleotides, the products from the two reactions can be
separated on a high-resolution gel. Bands that are much darker in one
lane
compared with another represent mRNA species that were overexpressed in
one cell population compared with another. The cDNA representing this
band
can be recovered from the gel for further analysis and identification.
Serial
Analysis of Gene
Expression (SAGE)
Every cell type
is thought to have a unique pattern of gene expression, the analysis of
which can reveal the underlying mechanism of disease. The most
straightforward way
to display this unique pattern of gene expression would be to construct
a cDNA library from the tissue of interest and sequence every clone.
This is obviously an impossible task. Rather, a technique called
“serial analysis of gene expression (SAGE)” achieves the same end in a
practical manner. In
SAGE, the investigator sequences a small and unique fragment of each
expressed gene (called a SAGE tag) and quantifies the number of times
it appears (called the SAGE tag number). The SAGE tag numbers,
therefore, directly reflect the abundance of the corresponding
transcript.
The sensitivity
and the quantitative accuracy of SAGE are theoretically unlimited. The
generation of a SAGE library does not require any prior knowledge of
what genes are expressed in the cell of interest. Therefore, unlike DNA
chip analysis, SAGE is able to detect and quantify the expression of
previously uncharacterized genes. SAGE is based on two fundamental
principles:
1. A
short (10–11 bp) oligonucleotide fragment (SAGE tag) is sufficient to
uniquely identify a specific mRNA transcript or its cognate cDNA. A
10-bp
oligonucleotide sequence has a complexity of 410 different
combinations.
Because there are only about 100,000 genes encoded by the human genome,
a 10-bp sequence tag corresponding to a defined position of a cDNA
is sufficient to uniquely identify any transcribed human gene.
2.
Multiple 10-base-pair SAGE tags can be concatenated in a single
plasmid, thereby greatly compressing the number of actual plasmid
preparations and DNA sequencing reactions
that are required to analyze a large number of genes. In practice, a
single
sequencing reaction can provide information on 30 to 35 different SAGE
tags,
and therefore 30 to 35 different genes.
The generation
of a SAGE library is a technically demanding, multi-step procedure that
has been described in detail. Figure 7 outlines the essence of the
method. SAGE has been used to characterize the yeast “transcriptome”
(transcriptome is defined as the identity and expression level of all
the genes expressed in a cell population at any given time), monitor
alterations in gene expression patterns following ionizing radiation,
during apoptosis induced by the p53 and the APC tumor suppressor
proteins. In all of these cases, the ability to measure the expression
levels of thousands of different transcripts simultaneously was
extremely useful for the understanding of these physiologic processes.
For example, in the case of p53, the analysis of over 100,000 SAGE tags
identified not only several novel genes transcriptionally induced by
p53, but also the concurrent induction of a group of genes involved in
the regulation of cellular redox status. This led the authors to
propose a novel mechanism of p53-induced cell death. The application of
SAGE to the comparison of
the expression profiles of normal and tumor tissues is probably the
most
attractive one, since by comparing the expression profiles of normal
and
cancer cells in a comprehensive way, it is possible to identify genes
or subsets of genes that could be used as potential
diagnostic/prognostic markers or therapeutic targets.
Figure 7:
Construction and analysis
of SAGE libraries. In step 1, a cDNA library is constructed from the
cells or tissue of interest, and the cDNAs immobilized on magnetic
beads at their 3' ends. In step 2, the cDNAs are subjected to
restriction enzyme digestion with a so-called “anchoring enzyme.” This
anchoring enzyme is a “frequent cutter” restriction endonuclease
(usually NlaIII) that ensures that all the cDNAs are cut at least once.
In step 3, cleaved cDNAs are divided into two pools. Short
oligonucleotide linkers are ligated to the newly cut 5' ends of the
tags. A different linker is used for each pool (linkers A and B as
shown). These oligonucleotide linkers contain a recognition site for a
“tagging enzyme”. This tagging enzyme is a type two restriction
endonuclease (usually BsmfI) that cuts at some distance to the 3' side
of the actual recognition site. In step 4, “SAGE tags” are released by
cleavage with the tagging enzyme and further processed to yield blunt
ends. In step 5, the free, blunt-ended SE tags are dimerized to yield
ditags. These ditags are amplified by PCR using linker A and B primers.
Note that each ditag is flanked by the recognition site for the
frequent cutter anchoring enzyme used in step 2. These flanking
recognition sites serve as “punctuation marks” for sequence analysis of
the concatenated SAGE tags. Once sufficient amounts of ditags are
generated, they are ligated together in linear arrays containing
several ditags (i.e., they are concatemerized) and subcloned into a
plasmid that can be used as template for automated sequencing. Each
sequenced plasmid can yield data on 30 - 35 SAGE tags. Data are
analyzed by using the SAGE-software that reads the sequence obtained,
derives the SAGE tags, matches them to their cognate cDNA, and gives
the gene expression profile in a numeric format.

Ribozymes
One of the more
surprising discoveries of the past decade was that some RNA molecules
have
enzymatic activity. These RNAs, called “ribozymes,” can cleave RNA
at sequence-specific sites. They were originally discovered in
Tetrahymena,
when it appeared that some of the primary RNA molecules in that species
were capable of splicing out their introns without the aid of any
protein
enzymes. Ribozymes have also recently been described in higher
organisms,
and it is likely that they will be found to play a universal and
important role in RNA processing. Sequence-specific ribozymes which
will destroy specific mRNAs can be synthesized. One application of this
technology is the introduction into malignant cells of ribozymes
directed against
activated oncogenes. In the laboratory, this technique can reverse the
malignant phenotype of some cancer cells.
Gene
expression
profiling using a novel method:
amplified
differential gene expression (ADGE)
Zhijian J. Chen,
Hongxie Shen & Kenneth D. Tew
Nucleic Acids Res. 2001; 29: e46
Amplified differential
gene expression (ADGE) is a novel
technique, designed to profile gene expression of the whole
transcriptome or to compare expression of a set of genes between two
samples. ADGE employs hybridization to quadratically amplify the ratio
of an expressed gene between control and tester samples before
displaying. The subtle structures of adapters and primers are designed
for displaying the amplified ratio of an expressed gene between two
samples. Four selective nucleotides at the 3' end of primers are used
to increase PCR efficiency for targeted molecules and to improve
detection of PCR products. Double PCR with the same
pair of primers expands
the detection range, especially for genes of low abundance. Integration
of these steps makes ADGE sensitive
and accurate. Application to drug resistant human tumor cell lines
showed that ADGE accurately profiled expression levels for induced,
repressed or unchanged genes. The qualitative expression patterns for
ADGE were verified with RT–PCR.
Summary
The genetic
information in DNA is copied, or “transcribed,” into mRNA by the enzyme
RNA polymerase II. Before being transported to the cytoplasm, primary
transcripts in the nucleus are modified by splicing out introns, adding
a 5´ cap and adding a 3´ poly(A) tract. Cytoplasmic mRNA
can be detected by Northern blotting, nuclease protection assays, or by
modified PCR. Although nuclease protection assays are technically
somewhat more demanding than Northern blotting, they are more sensitive
and can provide structural information about mRNA transcripts. A
retroviral enzyme called reverse transcriptase can make cDNA copies of
mRNA transcripts. These cDNAs
can be cloned into cDNA libraries, which are useful for isolating and
analyzing expressed genes. In the future, ribozymes may be useful for
the selective elimination of specific mRNA spezies.
|


